

odderling
-
Innlegg
193 -
Ble med
-
Besøkte siden sist
Innholdstype
Profiler
Forum
Hendelser
Blogger
Om forumet
Innlegg skrevet av odderling
-
-
Det er så mye som 872 248 K
Men jeg mener å huske at det samme skjedde da jeg brukte 2 GIG RAM og da men
-
jada har patched til nyeste version skal se hvor mye av minnet som går til bf2 når det crasher om et par minutter.
Må bare få det til å crashe først...

EDIT: BF2 bruker faktisk 99 %.
Så det vil si at det er så enkelt at det er pga bare 1 gig RAM?!
-
Når jeg søker på "Aidll.dll" eller "Aidll" så kommer det ikke opp noe som helst!
Så hva FA*N?!
kan prøve å gjøre det etter skjermkort drivern har crashet for windows virker det er bare det at oppløsning og farger er fint blandet!
-
Men er process explorer et program innenfor windows som jeg kan kjøre via WIN + R?
-
som jeg skrv lengre oppe så vet jeg ikke om det er relatert men jeg kjører bare med 1 gig RAM for tiden så kan det hjelpe siden det ser ut som den går tom for minne..
-
ja det kan jeg se men den blir ikke lagret i C:\windows\Minidump.
Den blir lagret i mine dokumenter i BF2 (Det jeg spillte da det hendte) mappen og så i mappen som heter dmp og der er det ikke mindre enn 49 dump filer og om jeg prøver å åpne en av de med Windbg så kommer det opp:
Microsoft (R) Windows Debugger Version 6.8.0004.0 X86
Copyright (c) Microsoft Corporation. All rights reserved.


Loading Dump File [C:\Documents and Settings\Odd Erling\Mine dokumenter\Battlefield 2\dmp\bf2_v1.1.2965-797.0_2008-03-16_10.17.21.dmp]
User Mini Dump File: Only registers, stack and portions of memory are available

Comment: 'Battlefield2 MiniDump. Address: 0D04C6F6 (In Windbg type: .ecxr)
ASSERT INFORMATION:
[...]
[EOF]'
Symbol search path is: srv*c:\symbols*http://msdl.microsoft.com/downloads/symbols
Executable search path is: srv*c:\symbols*http://msdl.microsoft.com/downloads/symbols
Windows XP Version 2600 (Service Pack 2) MP (4 procs) Free x86 compatible
Product: WinNt, suite: SingleUserTS
Debug session time: Sun Mar 16 10:17:21.000 2008 (GMT+1)
System Uptime: not available
Process Uptime: 0 days 0:22:12.000
...................................................................................
This dump file has an exception of interest stored in it.
The stored exception information can be accessed via .ecxr.
(524.fb4): Access violation - code c0000005 (first/second chance not available)
eax=00000001 ebx=00000000 ecx=00000000 edx=08ab0024 esi=000003b4 edi=00000000
eip=7c90eb94 esp=0012f7d4 ebp=0012f838 iopl=0		 nv up ei pl zr na pe nc
cs=001b  ss=0023  ds=0023  es=0023  fs=003b  gs=0000			 efl=00200246
ntdll!KiFastSystemCallRet:
7c90eb94 c3			  ret
0:000> !analyze -v
*******************************************************************************
*																			 *
*						Exception Analysis								   *
*																			 *
*******************************************************************************

*** WARNING: Unable to verify checksum for BF2.exe
*** ERROR: Module load completed but symbols could not be loaded for BF2.exe
*************************************************************************
***																   ***
***																   ***
***	Your debugger is not using the correct symbols				 ***
***																   ***
***	In order for this command to work properly, your symbol path   ***
***	must point to .pdb files that have full type information.	  ***
***																   ***
***	Certain .pdb files (such as the public OS symbols) do not	  ***
***	contain the required information.  Contact the group that	  ***
***	provided you with these symbols if you need this command to	***
***	work.														  ***
***																   ***
***	Type referenced: kernel32!pNlsUserInfo						 ***
***																   ***
*************************************************************************
*************************************************************************
***																   ***
***																   ***
***	Your debugger is not using the correct symbols				 ***
***																   ***
***	In order for this command to work properly, your symbol path   ***
***	must point to .pdb files that have full type information.	  ***
***																   ***
***	Certain .pdb files (such as the public OS symbols) do not	  ***
***	contain the required information.  Contact the group that	  ***
***	provided you with these symbols if you need this command to	***
***	work.														  ***
***																   ***
***	Type referenced: kernel32!pNlsUserInfo						 ***
***																   ***
*************************************************************************

FAULTING_IP:
AIDLL!deinitDll+982e6
0d04c6f6 8b4e28		  mov	 ecx,dword ptr [esi+28h]

EXCEPTION_RECORD:  ffffffff -- (.exr 0xffffffffffffffff)
ExceptionAddress: 0d04c6f6 (AIDLL!deinitDll+0x000982e6)
  ExceptionCode: c0000005 (Access violation)
 ExceptionFlags: 00000000
NumberParameters: 2
  Parameter[0]: 00000000
  Parameter[1]: 00000028
Attempt to read from address 00000028

DEFAULT_BUCKET_ID:  NULL_POINTER_READ

PROCESS_NAME:  BF2.exe

ERROR_CODE: (NTSTATUS) 0xc0000005 - Instruksjonen i "0x%08lx" refererte til adresse "0x%08lx". Minnet kunne ikke v re "%s".

READ_ADDRESS:  00000028

NTGLOBALFLAG:  0

LAST_CONTROL_TRANSFER:  from 0d068593 to 0d04c6f6

STACK_TEXT:
WARNING: Stack unwind information not available. Following frames may be wrong.
0012fc7c 0d068593 00000001 00000002 c133777b AIDLL!deinitDll+0x982e6
0012fca4 0d069ab0 00000002 10b9f64c 00000000 AIDLL!deinitDll+0xb4183
0012fce8 0d0813a4 40000000 405c8444 10b9f31c AIDLL!deinitDll+0xb56a0
0012fd08 0d0302d6 40000000 405c8444 08f180cc AIDLL!deinitDll+0xccf94
0012fd1c 0cfed586 40000000 405c8444 0327209c AIDLL!deinitDll+0x7bec6
0012fd50 0cf9108b 004b7b1f 20000000 3fa11111 AIDLL!deinitDll+0x39176
0012fdb4 7c3a4ec3 00000000 0000000b 014623a0 AIDLL+0x108b
0012fdc8 7c3b2c75 01511020 00478e54 0012fe1c msvcp71!std::basic_string<char,std::char_traits<char>,std::allocator<char> >::compare+0x21
0012fdf0 7c3a1ce3 00000000 ffffffff 7c3a1e96 msvcp71!std::operator<<char,std::char_traits<char>,std::allocator<char> >+0xd
0012fedc 7c910970 014529a8 00400000 00000000 msvcp71!std::basic_string<char,std::char_traits<char>,std::allocator<char> >::_Tidy+0x45
0012ffc0 7c816fd7 00310036 00340039 7ffdf000 ntdll!RtlReleasePebLock+0xf
0012fd8c 0040d003 00000000 3d088889 00142367 kernel32!BaseProcessStart+0x23
0012fedc 7c910970 014529a8 00400000 00000000 BF2+0xd003
0012ffc0 7c816fd7 00310036 00340039 7ffdf000 ntdll!RtlReleasePebLock+0xf
0012fec0 00402b9d 00400000 00000000 00142367 kernel32!BaseProcessStart+0x23
0012ffc0 7c816fd7 00310036 00340039 7ffdf000 BF2+0x2b9d
0012ff18 00829c2d 00400000 00000000 00142367 kernel32!BaseProcessStart+0x23
0012ffc0 7c816fd7 00310036 00340039 7ffdf000 BF2+0x429c2d
0012fff0 00000000 00ac406e 00000000 00000000 kernel32!BaseProcessStart+0x23


STACK_COMMAND:  ~0s; .ecxr; kb

FAULTING_THREAD:  00000fb4

PRIMARY_PROBLEM_CLASS:  NULL_POINTER_READ

BUGCHECK_STR:  APPLICATION_FAULT_NULL_POINTER_READ

FOLLOWUP_IP:
AIDLL!deinitDll+982e6
0d04c6f6 8b4e28		  mov	 ecx,dword ptr [esi+28h]

SYMBOL_STACK_INDEX:  0

SYMBOL_NAME:  AIDLL!deinitDll+982e6

FOLLOWUP_NAME:  MachineOwner

MODULE_NAME: AIDLL

IMAGE_NAME:  AIDLL.dll

DEBUG_FLR_IMAGE_TIMESTAMP:  4519928b

FAILURE_BUCKET_ID:  AIDLL.dll!deinitDll_c0000005_NULL_POINTER_READ

BUCKET_ID:  APPLICATION_FAULT_NULL_POINTER_READ_AIDLL!deinitDll+982e6

Followup: MachineOwner
---------
Så finner du noe spennende her Fenderebest?
-
De sier at 1 bilde sier 1000 ord så...
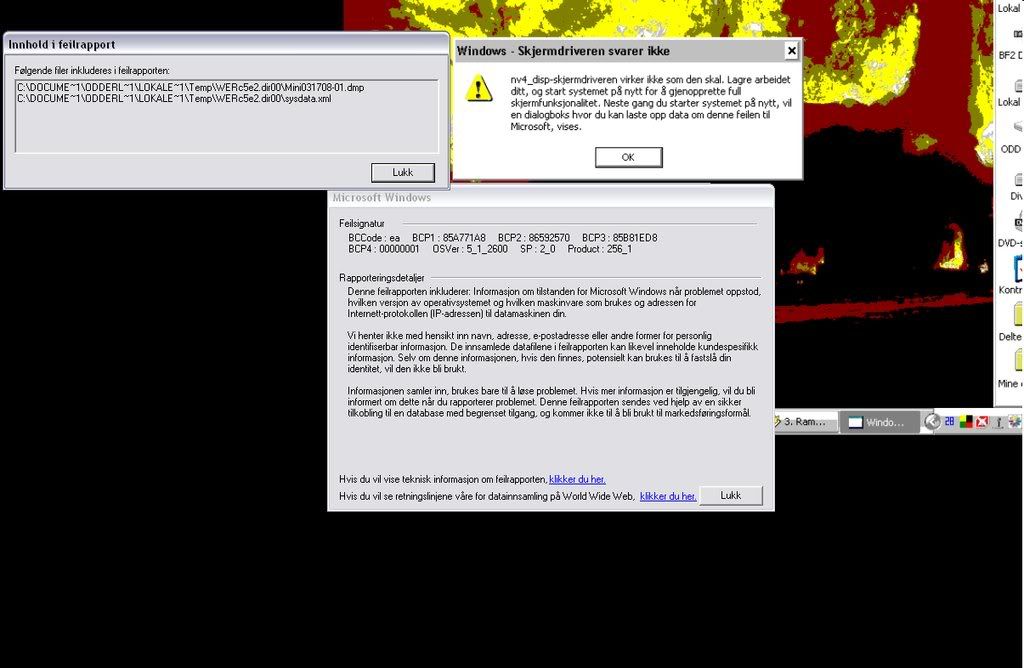
Dette skjer bare når jeg holder på med 3d applikasjoner.
Driverne er oppdatert og er innstalert skikkelig, kan det hende at det har noe å si at jeg har dual screen?
Om det kan vere relatert vet jeg ikke men om jeg prøver å starte PC-en med to RAM brikker så vil den ikke laste POST og det skjer ikke noe og jeg får ikke bilde.
-
hm, jeg oppdaterte BIOS til 0704 og nå kan jeg ikke starte PC-en med to moduler eller for å være mer spesifiks så kan jeg bare starte PC-en når brikke 1 står i.
Om jeg prøver med begge så kan jeg ikke starte, prøver jeg med brikke 2 så starter den heller ikke!
Det virker som brikke 2 er ustabil og "baja" siden den virker bare av og til.
Noen som har en formening om jeg bør kjøpe nye?
Sorry chrlod for å rappe litt av tråden din...
-
Jeg ser det ikke er bare meg som har det problemet.
Har samme RAM og MB bare ikke premium, men jeg er ikke sikker på om det har noe med det å gjøre.
Om jeg kjører memtest så finner den ikke noe problem, men om jeg begynner å spille så tar det gjerne 2 timer eller så og så klikker det helt.
Om jeg har musikk spillende så fortsetter den men bildet har fryst seg.
Det fører til at jeg må restarte, men tingen med meg er at i det PC-en skal restarte seg så stopper den/ det blir ikke bilde, og jeg må ta ut en spesiel brikke og så starte på nytt og da kommer det opp at OC ble ikke loadet skikkelig og jeg skrur av PC-en og setter i igjenn den RAM brikken jeg tok ut og så bruker det å virke!
-
Endelig fikk jeg fikset problemet! Etter å ha lest igjennom frundt 6-7 sider her i "maskinen fungerer ikke" forumet så la jeg merke til at det var noen som sa at en kan prøve å bytte plass på RAM brikkene og det gjorde jeg, og vips så fikk jeg bilde igjenn og alt virket som det skal.
-
*BUMP* Er det noen som kan hjelpe meg?
-
har du sjekket om skjermkabelen er skikkelig festet til skjermkortet?
Hadde det samme problemet når jeg og en venn satte sammen min pc for jeg trodde han satte til skruene men det gjorde han ikke og jeg slet lenge med å finne ut hva det var.
-
Jeg overklokket skjermkortet med rivatuner og der var det en funksjon som gjør at jeg kan defaulte OC'ingen. jeg trykkte på knappen og så måtte jeg restarte PC-en og det skjedde automatisk og så når den skulle starte iigjenn så sanurret vifta på skjermkortet for fullt og det ble ikke bilde på skjermene.
Har prøvd å tatt ut batteriet på hovedkortet samt å ta ut strøm ledningen og latt strømen gå ut av strømforskyningen. Så andre tips godtar jeg med åpne armer!!
-
Etter en del driver problemer så tenkte jeg at jeg skulle defaulte overklokkingen jeg hadde satt. i det jeg trykker på å defaulte OC'ingen så står det at jeg me restarte PC-en så jeg trykker bare ok og PC-en skrur seg av.
Men i det PC-en prøver å starte opp igjenn så snurrer skjermkort vifta for 100 % og jeg får ikke noe bilde på skjermene mine overhode.
Så hjelp, nå er det straks sønndag og de er alltid kjedelig uten pc!!
-
CA midt i 3DMark så stopper "filmen" og så etter en liten stund så kommer det opp at driverne ikke virker som de skal og at jeg må restarte for at jeg skal få alle funksjonene.
Det er forferdelig irriterende og jeg har reinstallert driveren for skjermkortet så sent som i dag!
-
Jeg har slettet alt av eksternt skrivebord og re-innstalert alle driverne og det ser ut som det har hjelpt!
men jeg får også en type crash der bildet bare fryser seg og lyden looper det siste sekundet.
Det blir ikke blue screen det bare henger seg opp. Noen anelse om det er relatert til dump filene?
-
Jeg har rotet littt rundt i debuging programet og jeg ser at det står tre forskjellige "probably caused" programer.
Dump 1
Klikk for å se/fjerne innholdet nedenfor<Microsoft ® Windows Debugger Version 6.8.0004.0 X86Copyright © Microsoft Corporation. All rights reserved.
Loading Dump File [C:\WINDOWS\Minidump\Mini030508-02.dmp]
Mini Kernel Dump File: Only registers and stack trace are available
Symbol search path is: srv*c:\symbols*http://msdl.microsoft.com/downloads/symbols
Executable search path is: srv*c:\symbols*http://msdl.microsoft.com/downloads/symbols
Windows XP Kernel Version 2600 (Service Pack 2) MP (4 procs) Free x86 compatible
Product: WinNt, suite: TerminalServer SingleUserTS
Built by: 2600.xpsp_sp2_gdr.070227-2254
Kernel base = 0x804d7000 PsLoadedModuleList = 0x8055c700
Debug session time: Wed Mar 5 18:55:05.531 2008 (GMT+1)
System Uptime: 0 days 0:05:15.172
Loading Kernel Symbols
..........................................................................................
...................................................
Loading User Symbols
Loading unloaded module list
.........
*******************************************************************************
* *
* Bugcheck Analysis *
* *
*******************************************************************************
Use !analyze -v to get detailed debugging information.
BugCheck 1000008E, {c0000005, 80545d11, b4a5b858, 0}
Probably caused by : win32k.sys ( win32k!RBRUSH::vRemoveRef+e )
Followup: MachineOwner
---------
3: kd> !analyze -v
*******************************************************************************
* *
* Bugcheck Analysis *
* *
*******************************************************************************
KERNEL_MODE_EXCEPTION_NOT_HANDLED_M (1000008e)
This is a very common bugcheck. Usually the exception address pinpoints
the driver/function that caused the problem. Always note this address
as well as the link date of the driver/image that contains this address.
Some common problems are exception code 0x80000003. This means a hard
coded breakpoint or assertion was hit, but this system was booted
/NODEBUG. This is not supposed to happen as developers should never have
hardcoded breakpoints in retail code, but ...
If this happens, make sure a debugger gets connected, and the
system is booted /DEBUG. This will let us see why this breakpoint is
happening.
Arguments:
Arg1: c0000005, The exception code that was not handled
Arg2: 80545d11, The address that the exception occurred at
Arg3: b4a5b858, Trap Frame
Arg4: 00000000
Debugging Details:
------------------
EXCEPTION_CODE: (NTSTATUS) 0xc0000005 - Instruksjonen i "0x%08lx" refererte til adresse "0x%08lx". Minnet kunne ikke v re "%s".
FAULTING_IP:
nt!__InterlockedDecrement+5
80545d11 f00fc101 lock xadd dword ptr [ecx],eax
TRAP_FRAME: b4a5b858 -- (.trap 0xffffffffb4a5b858)
ErrCode = 00000002
eax=ffffffff ebx=00000001 ecx=00002000 edx=dd280005 esi=00002000 edi=88011431
eip=80545d11 esp=b4a5b8cc ebp=b4a5b8d4 iopl=0 nv up ei pl nz na pe nc
cs=0008 ss=0010 ds=0023 es=0023 fs=0030 gs=0000 efl=00010206
nt!__InterlockedDecrement+0x5:
80545d11 f00fc101 lock xadd dword ptr [ecx],eax ds:0023:00002000=????????
Resetting default scope
CUSTOMER_CRASH_COUNT: 2
DEFAULT_BUCKET_ID: DRIVER_FAULT
BUGCHECK_STR: 0x8E
PROCESS_NAME: firefox.exe
LAST_CONTROL_TRANSFER: from bf8079c2 to 80545d11
STACK_TEXT:
b4a5b8c8 bf8079c2 e6dc2538 b4a5b8f4 bf8093d2 nt!__InterlockedDecrement+0x5
b4a5b8d4 bf8093d2 00000001 b4a5b908 bf809427 win32k!RBRUSH::vRemoveRef+0xe
b4a5b8e0 bf809427 88011431 0000ffff 00000000 win32k!EBRUSHOBJ::vNuke+0x13
b4a5b8f4 bf80d2b3 00000000 00000000 bf80fafb win32k!XDCOBJ::bDeleteDC+0x4e
b4a5b90c bf80fb4c e25e0008 00000000 00000000 win32k!bDeleteDCInternal+0x134
b4a5b928 8054086c 88011431 0012f618 7c90eb94 win32k!NtGdiDeleteObjectApp+0x88
b4a5b928 7c90eb94 88011431 0012f618 7c90eb94 nt!KiFastCallEntry+0xfc
WARNING: Frame IP not in any known module. Following frames may be wrong.
0012f618 00000000 00000000 00000000 00000000 0x7c90eb94
STACK_COMMAND: kb
FOLLOWUP_IP:
win32k!RBRUSH::vRemoveRef+e
bf8079c2 85c0 test eax,eax
SYMBOL_STACK_INDEX: 1
SYMBOL_NAME: win32k!RBRUSH::vRemoveRef+e
FOLLOWUP_NAME: MachineOwner
MODULE_NAME: win32k
IMAGE_NAME: win32k.sys
DEBUG_FLR_IMAGE_TIMESTAMP: 45f013f6
FAILURE_BUCKET_ID: 0x8E_win32k!RBRUSH::vRemoveRef+e
BUCKET_ID: 0x8E_win32k!RBRUSH::vRemoveRef+e
Followup: MachineOwner
--------->
Dump 2
Klikk for å se/fjerne innholdet nedenfor<Microsoft ® Windows Debugger Version 6.8.0004.0 X86
Copyright © Microsoft Corporation. All rights reserved.
Loading Dump File [C:\WINDOWS\Minidump\Mini030508-03.dmp]
Mini Kernel Dump File: Only registers and stack trace are available
Symbol search path is: srv*c:\symbols*http://msdl.microsoft.com/downloads/symbols
Executable search path is: srv*c:\symbols*http://msdl.microsoft.com/downloads/symbols
Windows XP Kernel Version 2600 (Service Pack 2) MP (4 procs) Free x86 compatible
Product: WinNt, suite: TerminalServer SingleUserTS
Built by: 2600.xpsp_sp2_gdr.070227-2254
Kernel base = 0x804d7000 PsLoadedModuleList = 0x8055c700
Debug session time: Wed Mar 5 18:57:50.140 2008 (GMT+1)
System Uptime: 0 days 0:01:53.796
Loading Kernel Symbols
..........................................................................................
.................................................
Loading User Symbols
Loading unloaded module list
...........
*******************************************************************************
* *
* Bugcheck Analysis *
* *
*******************************************************************************
Use !analyze -v to get detailed debugging information.
BugCheck 1000008E, {c0000005, bf802997, b521bba4, 0}
Probably caused by : win32k.sys ( win32k!PopAndFreeW32ThreadLock+15 )
Followup: MachineOwner
---------
0: kd> !analyze -v
*******************************************************************************
* *
* Bugcheck Analysis *
* *
*******************************************************************************
KERNEL_MODE_EXCEPTION_NOT_HANDLED_M (1000008e)
This is a very common bugcheck. Usually the exception address pinpoints
the driver/function that caused the problem. Always note this address
as well as the link date of the driver/image that contains this address.
Some common problems are exception code 0x80000003. This means a hard
coded breakpoint or assertion was hit, but this system was booted
/NODEBUG. This is not supposed to happen as developers should never have
hardcoded breakpoints in retail code, but ...
If this happens, make sure a debugger gets connected, and the
system is booted /DEBUG. This will let us see why this breakpoint is
happening.
Arguments:
Arg1: c0000005, The exception code that was not handled
Arg2: bf802997, The address that the exception occurred at
Arg3: b521bba4, Trap Frame
Arg4: 00000000
Debugging Details:
------------------
EXCEPTION_CODE: (NTSTATUS) 0xc0000005 - Instruksjonen i "0x%08lx" refererte til adresse "0x%08lx". Minnet kunne ikke v re "%s".

FAULTING_IP:
win32k!PopAndFreeW32ThreadLock+15
bf802997 8b11			mov	 edx,dword ptr [ecx]

TRAP_FRAME:  b521bba4 -- (.trap 0xffffffffb521bba4)
ErrCode = 00000000
eax=e1047c28 ebx=00000000 ecx=00002000 edx=80000000 esi=e1047c28 edi=00000000
eip=bf802997 esp=b521bc18 ebp=b521bc18 iopl=0		 nv up ei pl nz na pe nc
cs=0008  ss=0010  ds=0023  es=0023  fs=0030  gs=0000			 efl=00010206
win32k!PopAndFreeW32ThreadLock+0x15:
bf802997 8b11			mov	 edx,dword ptr [ecx]  ds:0023:00002000=????????
Resetting default scope

CUSTOMER_CRASH_COUNT:  3

DEFAULT_BUCKET_ID:  DRIVER_FAULT

BUGCHECK_STR:  0x8E

PROCESS_NAME:  explorer.exe

LAST_CONTROL_TRANSFER:  from bf820429 to bf802997

STACK_TEXT:
b521bc18 bf820429 00002000 e1047c28 b521bc60 win32k!PopAndFreeW32ThreadLock+0x15
b521bc28 bf820207 e1047c28 893e6dc0 e1047c28 win32k!CleanupW32ThreadLocks+0x11
b521bc3c bf8209b0 8914fda8 00000000 00000000 win32k!DestroyThreadsObjects+0x25
b521bc60 bf819e30 00000001 b521bc88 bf819ef4 win32k!xxxDestroyThreadInfo+0x1cf
b521bc6c bf819ef4 8914fda8 00000001 00000000 win32k!UserThreadCallout+0x4b
b521bc88 805d0d38 8914fda8 00000001 8914fda8 win32k!W32pThreadCallout+0x3d
b521bd14 805d1150 00000000 00000000 8914fda8 nt!PspExitThread+0x3cc
b521bd34 805d1490 8914fda8 00000000 b521bd64 nt!PspTerminateThreadByPointer+0x52
b521bd54 8054086c 00000000 00000000 0164ffb4 nt!NtTerminateThread+0x70
b521bd54 7c90eb94 00000000 00000000 0164ffb4 nt!KiFastCallEntry+0xfc
WARNING: Frame IP not in any known module. Following frames may be wrong.
0164ffb4 00000000 00000000 00000000 00000000 0x7c90eb94


STACK_COMMAND:  kb

FOLLOWUP_IP:
win32k!PopAndFreeW32ThreadLock+15
bf802997 8b11			mov	 edx,dword ptr [ecx]

SYMBOL_STACK_INDEX:  0

SYMBOL_NAME:  win32k!PopAndFreeW32ThreadLock+15

FOLLOWUP_NAME:  MachineOwner

MODULE_NAME: win32k

IMAGE_NAME:  win32k.sys

DEBUG_FLR_IMAGE_TIMESTAMP:  45f013f6

FAILURE_BUCKET_ID:  0x8E_win32k!PopAndFreeW32ThreadLock+15

BUCKET_ID:  0x8E_win32k!PopAndFreeW32ThreadLock+15

Followup: MachineOwner
--------->
Dump 3
Klikk for å se/fjerne innholdet nedenforMicrosoft ® Windows Debugger Version 6.8.0004.0 X86Copyright © Microsoft Corporation. All rights reserved.
Loading Dump File [C:\WINDOWS\Minidump\Mini030708-01.dmp]
Mini Kernel Dump File: Only registers and stack trace are available
Symbol search path is: srv*c:\symbols*http://msdl.microsoft.com/downloads/symbols
Executable search path is: srv*c:\symbols*http://msdl.microsoft.com/downloads/symbols
Windows XP Kernel Version 2600 (Service Pack 2) MP (4 procs) Free x86 compatible
Product: WinNt
Built by: 2600.xpsp_sp2_gdr.070227-2254
Kernel base = 0x804d7000 PsLoadedModuleList = 0x8055c700
Debug session time: Fri Mar 7 22:14:10.875 2008 (GMT+1)
System Uptime: 0 days 0:43:45.875
Loading Kernel Symbols
..........................................................................................
....................................................
Loading User Symbols
Loading unloaded module list
............
*******************************************************************************
* *
* Bugcheck Analysis *
* *
*******************************************************************************
Use !analyze -v to get detailed debugging information.
BugCheck A, {2000, 2, 1, 806e4a2a}
Unable to load image JGOGO.sys, Win32 error 0n2
*** WARNING: Unable to verify timestamp for JGOGO.sys
*** ERROR: Module load completed but symbols could not be loaded for JGOGO.sys
Probably caused by : afd.sys ( afd!AfdFastIoDeviceControl+5bd )
Followup: MachineOwner
---------
0: kd> !analyze -v
*******************************************************************************
* *
* Bugcheck Analysis *
* *
*******************************************************************************
IRQL_NOT_LESS_OR_EQUAL (a)
An attempt was made to access a pageable (or completely invalid) address at an
interrupt request level (IRQL) that is too high. This is usually
caused by drivers using improper addresses.
If a kernel debugger is available get the stack backtrace.
Arguments:
Arg1: 00002000, memory referenced
Arg2: 00000002, IRQL
Arg3: 00000001, bitfield :
bit 0 : value 0 = read operation, 1 = write operation
bit 3 : value 0 = not an execute operation, 1 = execute operation (only on chips which support this level of status)
Arg4: 806e4a2a, address which referenced memory
Debugging Details:
------------------
WRITE_ADDRESS: 00002000
CURRENT_IRQL: 2
FAULTING_IP:
hal!KeAcquireInStackQueuedSpinLock+3a
806e4a2a 8902 mov dword ptr [edx],eax
CUSTOMER_CRASH_COUNT: 1
DEFAULT_BUCKET_ID: DRIVER_FAULT
BUGCHECK_STR: 0xA
TRAP_FRAME: b5853a40 -- (.trap 0xffffffffb5853a40)
ErrCode = 00000002
eax=b5853ac4 ebx=b5853b1c ecx=8912c6cd edx=00002000 esi=8912c6b0 edi=00000000
eip=806e4a2a esp=b5853ab4 ebp=b5853b10 iopl=0 nv up ei ng nz na po nc
cs=0008 ss=0010 ds=0023 es=0023 fs=0030 gs=0000 efl=00010282
hal!KeAcquireInStackQueuedSpinLock+0x3a:
806e4a2a 8902 mov dword ptr [edx],eax ds:0023:00002000=????????
Resetting default scope
LAST_CONTROL_TRANSFER: from 806e4a2a to 80543930
STACK_TEXT:
b5853a40 806e4a2a badb0d00 00002000 00000000 nt!KiTrap0E+0x238
b5853b40 80534a4d 0019cc10 80560ec0 00000110 hal!KeAcquireInStackQueuedSpinLock+0x3a
b5853b10 b73cebc4 00001000 00a5f0dc b73cebc4 nt!ExReleaseResourceLite+0x8d
b5853c5c 8057f1fd 891cf418 00000001 00a5f010 afd!AfdFastIoDeviceControl+0x5bd
b5853d00 805780c2 000000f4 000000ec 00000000 nt!IopXxxControlFile+0x255
b5853d34 8054086c 000000f4 000000ec 00000000 nt!NtDeviceIoControlFile+0x2a
b5853d34 7c90eb94 000000f4 000000ec 00000000 nt!KiFastCallEntry+0xfc
WARNING: Frame IP not in any known module. Following frames may be wrong.
00a5f06c 00000000 00000000 00000000 00000000 0x7c90eb94
STACK_COMMAND: kb
FOLLOWUP_IP:
afd!AfdFastIoDeviceControl+5bd
b73cebc4 e955fdffff jmp afd!AfdFastIoDeviceControl+0xaf (b73ce91e)
SYMBOL_STACK_INDEX: 3
SYMBOL_NAME: afd!AfdFastIoDeviceControl+5bd
FOLLOWUP_NAME: MachineOwner
MODULE_NAME: afd
IMAGE_NAME: afd.sys
DEBUG_FLR_IMAGE_TIMESTAMP: 41107eb5
FAILURE_BUCKET_ID: 0xA_W_afd!AfdFastIoDeviceControl+5bd
BUCKET_ID: 0xA_W_afd!AfdFastIoDeviceControl+5bd
Followup: MachineOwner
--------->
btw vet ikke om det er relatert men jeg lastet ned ny shockwave og det ser ikke ut som FireFox er blitt mer stabil.
og her er en jeg fikk i dag

dump 4
Klikk for å se/fjerne innholdet nedenforMicrosoft ® Windows Debugger Version 6.8.0004.0 X86Copyright © Microsoft Corporation. All rights reserved.
Loading Dump File [C:\WINDOWS\Minidump\Mini030808-01.dmp]
Mini Kernel Dump File: Only registers and stack trace are available
Symbol search path is: srv*c:\symbols*http://msdl.microsoft.com/downloads/symbols
Executable search path is: srv*c:\symbols*http://msdl.microsoft.com/downloads/symbols
Windows XP Kernel Version 2600 (Service Pack 2) MP (4 procs) Free x86 compatible
Product: WinNt
Built by: 2600.xpsp_sp2_gdr.070227-2254
Kernel base = 0x804d7000 PsLoadedModuleList = 0x8055c700
Debug session time: Sat Mar 8 10:09:03.953 2008 (GMT+1)
System Uptime: 0 days 11:52:46.960
Loading Kernel Symbols
..........................................................................................
.................................................
Loading User Symbols
Loading unloaded module list
............
*******************************************************************************
* *
* Bugcheck Analysis *
* *
*******************************************************************************
Use !analyze -v to get detailed debugging information.
BugCheck A, {2008, 2, 0, 804e8178}
Unable to load image JGOGO.sys, Win32 error 0n2
*** WARNING: Unable to verify timestamp for JGOGO.sys
*** ERROR: Module load completed but symbols could not be loaded for JGOGO.sys
Probably caused by : ntkrpamp.exe ( nt!CcUnmapVacbArray+b0 )
Followup: MachineOwner
---------
1: kd> !analyze -v
*******************************************************************************
* *
* Bugcheck Analysis *
* *
*******************************************************************************
IRQL_NOT_LESS_OR_EQUAL (a)
An attempt was made to access a pageable (or completely invalid) address at an
interrupt request level (IRQL) that is too high. This is usually
caused by drivers using improper addresses.
If a kernel debugger is available get the stack backtrace.
Arguments:
Arg1: 00002008, memory referenced
Arg2: 00000002, IRQL
Arg3: 00000000, bitfield :
bit 0 : value 0 = read operation, 1 = write operation
bit 3 : value 0 = not an execute operation, 1 = execute operation (only on chips which support this level of status)
Arg4: 804e8178, address which referenced memory
Debugging Details:
------------------
READ_ADDRESS: 00002008
CURRENT_IRQL: 2
FAULTING_IP:
nt!CcUnmapVacbArray+b0
804e8178 66837e0800 cmp word ptr [esi+8],0
CUSTOMER_CRASH_COUNT: 1
DEFAULT_BUCKET_ID: DRIVER_FAULT
BUGCHECK_STR: 0xA
TRAP_FRAME: bacfba3c -- (.trap 0xffffffffbacfba3c)
ErrCode = 00000000
eax=00000001 ebx=00040000 ecx=885e22c8 edx=00000000 esi=00002000 edi=885e2298
eip=804e8178 esp=bacfbab0 ebp=bacfbacc iopl=0 nv up ei pl nz na pe nc
cs=0008 ss=0010 ds=0023 es=0023 fs=0030 gs=0000 efl=00010206
nt!CcUnmapVacbArray+0xb0:
804e8178 66837e0800 cmp word ptr [esi+8],0 ds:0023:00002008=????
Resetting default scope
LAST_CONTROL_TRANSFER: from 804e8178 to 80543930
STACK_TEXT:
bacfba3c 804e8178 badb0d00 00000000 893b5b40 nt!KiTrap0E+0x238
bacfbacc 804e51ec 00000000 00000000 885e22fc nt!CcUnmapVacbArray+0xb0
bacfbae8 804e54a7 885e2298 8930cd60 885e2298 nt!CcUnmapAndPurge+0x20
bacfbb18 804e5c07 00000000 e6d1ec08 8930cd60 nt!CcDeleteSharedCacheMap+0xc5
bacfbb34 ba548c35 00000000 00000000 00000000 nt!CcUninitializeCacheMap+0x12d
bacfbb58 ba546c1b e6d1ec08 00000000 00000000 Ntfs!NtfsDeleteInternalAttributeStream+0x98
bacfbb74 ba521800 88767208 e6d1ec08 00000000 Ntfs!NtfsRemoveScb+0x77
bacfbb90 ba525550 88767208 e6d1eb40 00000000 Ntfs!NtfsPrepareFcbForRemoval+0x52
bacfbbe0 ba546c7c 88767208 89cee100 e96d2cc8 Ntfs!NtfsTeardownFromLcb+0x2bc
bacfbc38 ba5217b0 88767208 e96d2d90 00000000 Ntfs!NtfsTeardownStructures+0x125
bacfbc64 ba5444b5 88767208 016d2d90 00000000 Ntfs!NtfsDecrementCloseCounts+0x9e
bacfbce8 ba5493e3 88767208 e96d2d90 e96d2cc8 Ntfs!NtfsCommonClose+0x397
bacfbd7c 805379bd 00000000 00000000 89e3eda8 Ntfs!NtfsFspClose+0xe3
bacfbdac 805ce84c 00000000 00000000 00000000 nt!ExpWorkerThread+0xef
bacfbddc 8054532e 805378ce 00000000 00000000 nt!PspSystemThreadStartup+0x34
00000000 00000000 00000000 00000000 00000000 nt!KiThreadStartup+0x16
STACK_COMMAND: kb
FOLLOWUP_IP:
nt!CcUnmapVacbArray+b0
804e8178 66837e0800 cmp word ptr [esi+8],0
SYMBOL_STACK_INDEX: 1
SYMBOL_NAME: nt!CcUnmapVacbArray+b0
FOLLOWUP_NAME: MachineOwner
MODULE_NAME: nt
IMAGE_NAME: ntkrpamp.exe
DEBUG_FLR_IMAGE_TIMESTAMP: 45e53f9d
FAILURE_BUCKET_ID: 0xA_nt!CcUnmapVacbArray+b0
BUCKET_ID: 0xA_nt!CcUnmapVacbArray+b0
Followup: MachineOwner
--------->
Om det kan vere til mere hjelp så er det ikke alltid det blir blue screen av og til så henger alt seg opp og lyden looper på det siste sekundet og så går det et lite minutt så kommer det opp "En kontakt har blitt frakoblet" så må jeg sette inn alle lyd-kabler som står bak på hovedkortet og så forklare realtek hva som er hva av de "nye" kablene.
-
ok, kommer og plager deg sikkert mere i morgen. men fire fox klikker fremdeles, kllikket faktisk tre ganger på å bare skrive denne kommentaren.
-
Om det kan være til hjelp så klikker fire fox stadig nå (slik ca 2-3 ganger i minuttet) skal prøve å avinstallere nå, så får se. skal jeg poste de to andre crash dumpene?
-
ja, jeg har www.logmein.com frogramvare innstalert og der er det mulighet for innloging!
Har to andre dump filer i C:\WINDOWS\Minidump mappen også.
-
jeg har og blitt plaget av crasher nå i det siste men jeg har ikke innstalert noen nye drivere men jeg har vert plaget av crasher siden min pc ble satt sammen.
Så jeg tar bare å copy/paster det jeg fikk i command - dump jeg.
EXCEPTION_CODE: (NTSTATUS) 0xc0000005 - Instruksjonen i "0x%08lx" refererte til adresse "0x%08lx". Minnet kunne ikke v re "%s". FAULTING_IP: win32k!PopAndFreeW32ThreadLock+15 bf802997 8b11 mov edx,dword ptr [ecx] TRAP_FRAME: b521bba4 -- (.trap 0xffffffffb521bba4) ErrCode = 00000000 eax=e1047c28 ebx=00000000 ecx=00002000 edx=80000000 esi=e1047c28 edi=00000000 eip=bf802997 esp=b521bc18 ebp=b521bc18 iopl=0 nv up ei pl nz na pe nc cs=0008 ss=0010 ds=0023 es=0023 fs=0030 gs=0000 efl=00010206 win32k!PopAndFreeW32ThreadLock+0x15: bf802997 8b11 mov edx,dword ptr [ecx] ds:0023:00002000=???????? Resetting default scope CUSTOMER_CRASH_COUNT: 3 DEFAULT_BUCKET_ID: DRIVER_FAULT BUGCHECK_STR: 0x8E PROCESS_NAME: explorer.exe LAST_CONTROL_TRANSFER: from bf820429 to bf802997 STACK_TEXT: b521bc18 bf820429 00002000 e1047c28 b521bc60 win32k!PopAndFreeW32ThreadLock+0x15 b521bc28 bf820207 e1047c28 893e6dc0 e1047c28 win32k!CleanupW32ThreadLocks+0x11 b521bc3c bf8209b0 8914fda8 00000000 00000000 win32k!DestroyThreadsObjects+0x25 b521bc60 bf819e30 00000001 b521bc88 bf819ef4 win32k!xxxDestroyThreadInfo+0x1cf b521bc6c bf819ef4 8914fda8 00000001 00000000 win32k!UserThreadCallout+0x4b b521bc88 805d0d38 8914fda8 00000001 8914fda8 win32k!W32pThreadCallout+0x3d b521bd14 805d1150 00000000 00000000 8914fda8 nt!PspExitThread+0x3cc b521bd34 805d1490 8914fda8 00000000 b521bd64 nt!PspTerminateThreadByPointer+0x52 b521bd54 8054086c 00000000 00000000 0164ffb4 nt!NtTerminateThread+0x70 b521bd54 7c90eb94 00000000 00000000 0164ffb4 nt!KiFastCallEntry+0xfc WARNING: Frame IP not in any known module. Following frames may be wrong. 0164ffb4 00000000 00000000 00000000 00000000 0x7c90eb94 STACK_COMMAND: kb FOLLOWUP_IP: win32k!PopAndFreeW32ThreadLock+15 bf802997 8b11 mov edx,dword ptr [ecx] SYMBOL_STACK_INDEX: 0 SYMBOL_NAME: win32k!PopAndFreeW32ThreadLock+15 FOLLOWUP_NAME: MachineOwner MODULE_NAME: win32k IMAGE_NAME: win32k.sys DEBUG_FLR_IMAGE_TIMESTAMP: 45f013f6 FAILURE_BUCKET_ID: 0x8E_win32k!PopAndFreeW32ThreadLock+15 BUCKET_ID: 0x8E_win32k!PopAndFreeW32ThreadLock+15 Followup: MachineOwner ---------
-
har fått problemer med OC'ingen min her nå for når jeg setter Core bus til 680 og Memory bus til 1000 så får jeg bare system crash og blue screen, temperaturen ligger stødig på ca 65c under full load etter et par timer.
Skjønner ikke hva det kan vere som forårsaker dette men det er fryktelig kjedelig når det skjer.
-
fikk det til nå, problemet var at jeg ikke hadde passord på PC-en og remote desktop godtok ikke at PC-en ikke var passord beskyttet!
-
Portene er allerede åpnet og blitt stresset!
Skjermkort driver crasher
i Maskinen fungerer ikke
Skrevet
Nei det tror jeg da ikke, eneste anti-virus programet som kjører er AVG free edition - control center.